There is a great deal of information available in the Analytics screen. With this article we will give you a brief overview of what you are seeing.
All the information described below will be shown for whatever filters have been chosen at the top of the page (date, experience, lot, region, etc.) Numbers below correspond to the numbers on the screen shot in red.
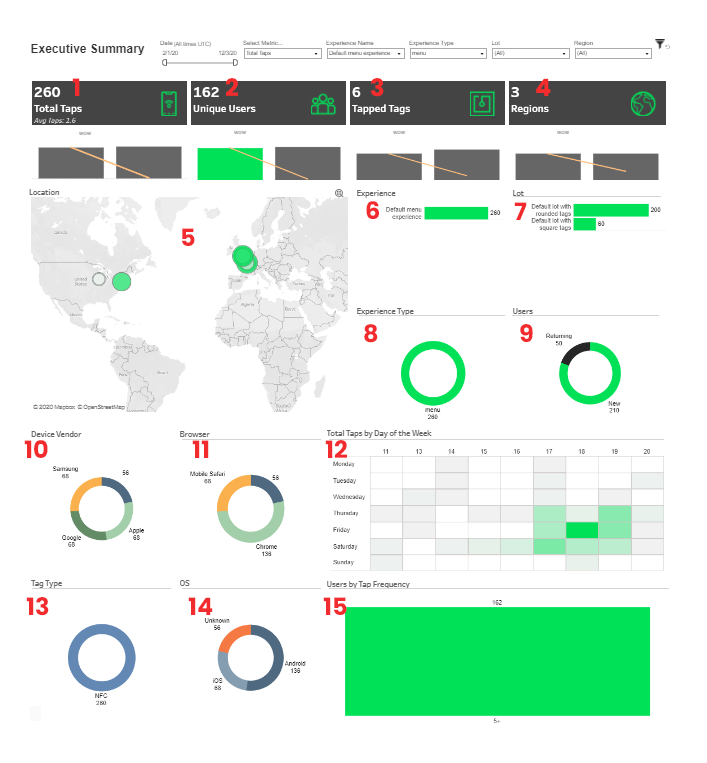
- Total Taps – Total number of taps on the NFC tags
- Unique Users – Number of unique users that tapped on tags
- Tapped Tags – Number of tags that have been tapped.
- Regions – Number of regions that had tapping.
- Map of Tapped Tags – Interactive map showing location of tags tapped.
- Experience – Graph of experiences accessed by tap
- Lot – Graph of Lot accessed by tap
- Experience Type – Breakdown of Menu vs. Sequence
- Users – Breakdown of New vs. Returning
- Device Vendor– Breakdown of phone vendor
- Browser – Breakdown of browser used
- Total Tags by Day of Week – Heat map of tapped tags by day and hour.
- Tag Type – Breakdown of NFC vs. QR code for experiences that have both.
- OS – Operating system of the phone
- User by Tap Frequency– User by number of times tapped.