At the top of the Analytics page, you can filter down the content of the graphs below based on several criteria. You can filter on a single one or combine the filters as necessary.

Available filters:
- Date – Use slider on left and right to limit date range displayed.
- Time Zone – Select the time zone you are in for evaluation
- Select Metric – Select the metric to be used for all of the charts and graphs (Choices: tapped tags, unique users, total taps)
- Experience Name – Limit displayed information to only certain experiences. Many can be selected from a list of possibilities.
- Experience Type – Show only Menu or Sequence or both.
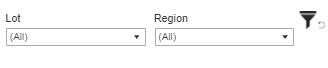
- Lot – Limit displayed info by Lot
- Region – Limit by region of taps
Filter Refresh symbol at right will reset all filters that have been set to default.